A Primer on Autism Spectrum Disorders (ASD)
- Malavika Ganesh
- Mar 4, 2022
- 8 min read
Edited by: Tanvi Sheth
Autism Spectrum Disorders (ASD) comprises a heterogeneous group of neurodevelopmental disorders primarily characterised by difficulty in communication and repetitive behaviour. The Diagnostic Statistical Manual of Mental Disorders, 5th Edition(DSM-V) has clubbed Autistic Disorder, Asperger’s Disorder, and Pervasive Developmental Disorder as opposed to DSM-IV and put them together as ASD. As ASD is a spectrum of disorders, the manifestation could be anywhere between mild to severe. As a result, there is no one symptom with which one can characterise ASD. ASD affects the individual’s mental health, as well as social, professional and educational aspects of life.
Currently, there is no clinical tool that is used as a strict diagnostic measure. Diagnosis of ASD takes a multifactorial approach, which consists of a series of psychiatric and psychological tests, using patient history for references and sometimes clinical tests such as MRI. A child is usually diagnosed by the age of 3-4, (when Typically Developing-TD children are able to communicate) judging by their inability to communicate, lack of eye contact while talking, extreme interest in one topic or activity, and failure to cross (or delayed) developmental milestones. For detailed criteria, an ASD checklist is used: DSM-V checklist for ASD
By the time the diagnosis takes place, there isn't much scope for alterations at a preventive level. Therefore, multiple aspects of ASD are being studied not only to treat those with ASD, but also to prevent ASD if possible at any stage. This blog gives an overview of ASD from a neuroscientific perspective, along with a few areas that hold promise for diagnosis and management of autism.
Characteristics of the ASD brain
Over the years, different studies have been able to bring out some features that differentiate an ASD brain from a typically developing (TD) brain. Some of these features are as follows:

Fig 1: Implications in brain regions responsible for social behaviour, language and communication in ASD (Adapted from Amaral et.al, 2008 Neuroanatomy of autism)
Neuroanatomical signs of autism
Cerebellum: Apart from the well known motor functions, recent studies show the involvement of cerebellum in language processing. Post mortem studies of ASD subjects have shown reduced hypoplasia of vermis lobules of the cerebellum. Meta analysis have also suggested a reduction of volume in vermis lobules, although this seems to be inconsistent across all studies. Apart from this, post mortem studies have shown reduction in the number of purkinje neurons of cerebellum. Mice models have shown that substances like valproic acid causes reduction in purkinje cells and induces ASD like behaviour. Research is yet to ascertain the relationship between ASD and the reduction of Purkinje cells.
Enlargement of the amygdala: The amygdala is a group of nuclei involved in the processing of emotions including fear, aggression and pleasure. Typically, MRI reports of ASD children have shown an enlarged amygdala compared to TD children of the same age. However this size difference is not observed in adolescents. Post-mortem studies of adult ASD patients have shown a decrease in number of neurons, suggesting that there is a precocious enlargement of amygdala in childhood, followed by slow growth in adolescence and probable degeneration in adulthood. It is also observed that the more enlarged the amygdala, the more the impairment.
Frontal cortex: MRI reports have suggested that upto 7% increase is found in ASD toddlers to children of comparable age. This increase could be upto 10% in white matter and upto 5% in grey matter.
Microscale differences
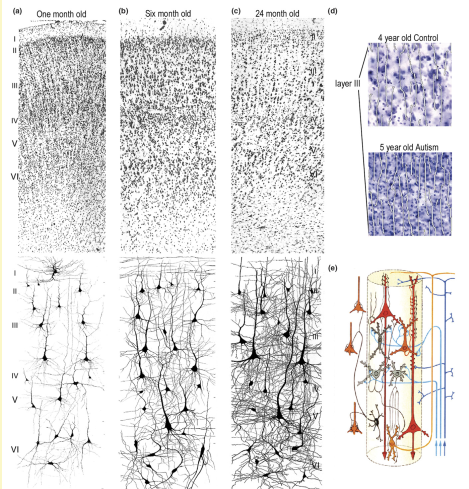
Minicolumn organisation: Axons are layered on each other in a stack like manner to form what is called minicolumn, during early stages of embryonic development. Post mortem studies have shown that the axons that make a minicolumn have lesser spacing in ASD patients, which could be caused by genetic or epigenetic changes at the early developmental stages. More evidence is needed on this as results were obtained from a small sample size.

Fig 2: (a),(b) and (c) show increase in width between neuronal cell bodies during development at different stages. Image on the right shows how minicolumn width doesn't increase with age in ASD children of comparable age. (Adapted from Amaral et.al, 2008 Neuroanatomy of autism)

Fig 3: Possible mechanisms due to which minicolumn structure is disorganised. The first row shows neural stem cells (NSCs) undergoing proper cell division to give rise to structurally normal minicolumns; the second row shows how genetic or epigenetic alterations could change gene expression in neurons leading to abnormal gene expression; the third row shows how increased cell division of NSCs can give rise to more neurons, thereby reducing minicolumn width. (Adapted from Donovan and Basson, 2017, Journal of Anatomy).
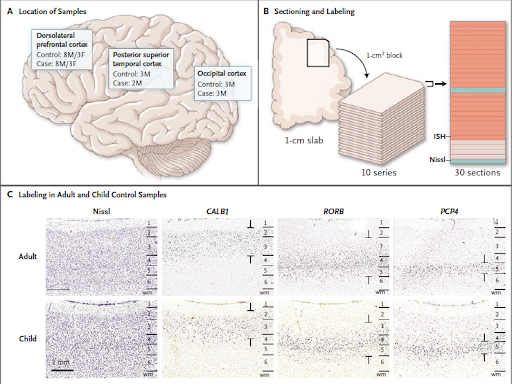
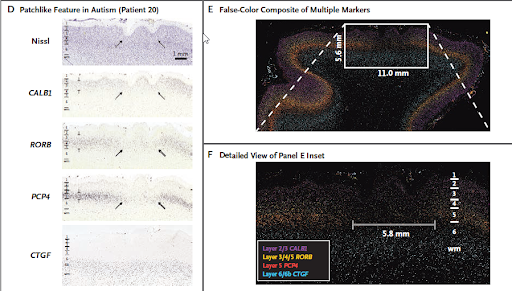
2. Focal disorganisation: An in-situ hybridization study (post mortem) demonstrated that tissues from the prefrontal cortex, temporal and occipital regions of the brain in 10 out of 11 kids showed 5-7mm patches of abnormal gene expression.

Fig 4: A: Locations of the dorsolateral prefrontal cortex, posterior superior temporal cortex and occipital cortex of the case and control samples. (M= male, F= female).
B: Pictorial depiction of the sectioning and labelling procedure: 1cm cube blocks of tissue cut from frozen slabs and sectioned into slices of 20 μm thickness. Each slice included all six layers. Each section was analyzed either
by using RNA in situ hybridization (ISH, in orange) or Nissl staining (in blue). RNA-ISH analyzed the expression patterns of 63 genes that included cortical layer–specific markers, genes implicated in the pathogenesis of autism, and putative cell-type markers. Nissil’s looked at the structure and integrity of the layers.
C: Raw images labelled using ISH alongside Nissl-labelled images for anatomical reference. Similar expression patterns observed in unaffected adults and children. Annotations demarcate different layers to depict layer-specific labelling.

Fig 5: D: ISH labelled images of an identified patch like region with abnormal expression (obtained from patient 20). Arrows indicate reduced or absent expression of neuronal markers in layers 2 or 3 through 5.
E: A false-colour image generated by overlaying images obtained from ISH of multiple markers, marking a defective region next to the normal cortex.
F: Inset from E zoomed in, showing the switch from cortical region with normal expression to a region of aberrant expression.
Additional research on autism
Observation from genetics: Other observations show inconsistencies in expression of area specific genes in the brain; for example, a gene specific to the frontal region might be expressed in temporal or occipital region.
Observations from metabolic studies suggest imbalance in the ratio of signaling metabolites. Among this, the most common one is an imbalance in the ratio of excitatory neurotransmitter glutamate and inhibitory GABA. The ratio leans towards glutamate, leading to a disrupted excitatory/inhibitory (E/I) balance.
Resting state functional connectivity studies: FC maps of ASD individuals can be compared to those of TD on the basis of activation levels. It could be underconnected (UC; meaning lower activation) with brain regions that are typically associated or be overconnected (OC; meaning higher activation) in non-traditional areas. Regional homogeneity and Independent component analysis studies suggest that OC could be lateralized to the right. Although early studies pointed at more short ranged and less long ranged connections overall, recent evidence suggest a reduced short- and long-range connectivity within functional systems, but stronger connectivity between functional systems.
The challenges with ASD
While some features (like increased brain size in toddlers) could be common in all kids, not all the points discussed above are necessarily seen. As mentioned at the beginning of this blog, across the autism spectrum, the extent of manifestation could be different, and usually impairment is proportional to the extent of manifestation.
Comorbidities: ASD could exist with other conditions like Down’s syndrome, ADHD, anxiety and depression making both diagnosis and treatment difficult.
Compensatory mechanism: There could be compensatory mechanisms at the behavioural and neuroanatomical level which may not be known. For example, certain connections may be seen due to ASD, or could potentially be a result of some compensatory mechanism.
Werling-Geschwind hypothesis and female protective effect: The male:female ratio of ASD individuals is 4:1, which could be linked to various genetic and environmental factors which decide the extent of manifestation of ASD. This theory states that despite reduced prevalence of ASD in females, it is likely that they carry a higher genetic load of ASD genes, but also have a higher threshold for reaching a stage of manifestation. There might be female protective factors in the sex chromosome which might be responsible for this.
The need for more data: More data is needed on ASD individuals in terms of imaging, genetics and post mortem studies.
Can AI based interventions help?
Since there is no single approach to diagnosis, AI has the potential to assimilate results from multiple approaches which could have implications for better diagnosis of ASD.
Radiomics uses large data from radiological images through complex algorithms to come to a decision, which can be used in diagnosis. Typically, an image (such as s-MRI) has features like colour (as greyscale of voxels), texture, shape/morphology, and spatial relationship, which could be used to tell a TD individual from an ASD individual.

Fig 6: From radiomics to ML: Schematic illustration of the entire process, beginning from image acquisition, followed by segmentation and then using multiple inputs to create an ML algorithm. (Adapted from Chaddad et.al.,2021, Diagnostics.)
3. Such images, along with data from functional connectivity, magnetic resonance spectroscopy, and psychological and psychiatric inputs can be modelled into a machine learning algorithm, which can help in earlier detection of ASD. Such studies are going on, and although the success rate is not as desired, AI-based interventions can be expected to help with the diagnosis of not just ASD, but also many other places in the field of medicine.
________________________________________________________________________
References:
Amaral, D.G., Schumann, C.M., Nordahl, C.W., 2008. Neuroanatomy of autism. Trends Neurosci. 31, 137–145. https://doi.org/10.1016/j.tins.2007.12.005
Bedford, S.A., Park, M.T.M., Devenyi, G.A., Tullo, S., Germann, J., Patel, R., Anagnostou, E., Baron-Cohen, S., Bullmore, E.T., Chura, L.R., Craig, M.C., Ecker, C., Floris, D.L., Holt, R.J., Lenroot, R., Lerch, J.P., Lombardo, M.V., Murphy, D.G.M., Raznahan, A., Ruigrok, A.N.V., Smith, E., Spencer, M.D., Suckling, J., Taylor, M.J., Thurm, A., Lai, M.-C., Chakravarty, M.M., 2020. Large-scale analyses of the relationship between sex, age and intelligence quotient heterogeneity and cortical morphometry in autism spectrum disorder. Mol. Psychiatry 25, 614–628. https://doi.org/10.1038/s41380-019-0420-6
Chaddad, A., Li, J., Lu, Q., Li, Y., Okuwobi, I.P., Tanougast, C., Desrosiers, C., Niazi, T., 2021. Can Autism Be Diagnosed with Artificial Intelligence? A Narrative Review. Diagnostics 11, 2032. https://doi.org/10.3390/diagnostics11112032
Donovan, A.P.A., Basson, M.A., 2017. The neuroanatomy of autism – a developmental perspective. J. Anat. 230, 4–15. https://doi.org/10.1111/joa.12542
Ecker, C., 2017. The neuroanatomy of autism spectrum disorder: An overview of structural neuroimaging findings and their translatability to the clinical setting. Autism 21, 18–28. https://doi.org/10.1177/1362361315627136
Hull, J.V., Dokovna, L.B., Jacokes, Z.J., Torgerson, C.M., Irimia, A., Van Horn, J.D., 2017. Resting-State Functional Connectivity in Autism Spectrum Disorders: A Review. Front. Psychiatry 7.
Moon, S.J., Hwang, J., Kana, R., Torous, J., Kim, J.W., 2019. Accuracy of Machine Learning Algorithms for the Diagnosis of Autism Spectrum Disorder: Systematic Review and Meta-Analysis of Brain Magnetic Resonance Imaging Studies. JMIR Ment. Health 6, e14108. https://doi.org/10.2196/14108
Nelson, S.B., Valakh, V., 2015. Excitatory/Inhibitory Balance and Circuit Homeostasis in Autism Spectrum Disorders. Neuron 87, 684–698. https://doi.org/10.1016/j.neuron.2015.07.033
Sato, W., Uono, S., 2019. The atypical social brain network in autism: advances in structural and functional MRI studies. Curr. Opin. Neurol. 32, 617–621. https://doi.org/10.1097/WCO.0000000000000713
Stoner, R., Chow, M.L., Boyle, M.P., Sunkin, S.M., Mouton, P.R., Roy, S., Wynshaw-Boris, A., Colamarino, S.A., Lein, E.S., Courchesne, E., 2014. Patches of Disorganization in the Neocortex of Children with Autism. N. Engl. J. Med. 370, 1209–1219. https://doi.org/10.1056/NEJMoa1307491
Walsh, M.J.M., Wallace, G.L., Gallegos, S.M., Braden, B.B., 2021. Brain-based sex differences in autism spectrum disorder across the lifespan: A systematic review of structural MRI, fMRI, and DTI findings. NeuroImage Clin. 31, 102719. https://doi.org/10.1016/j.nicl.2021.102719


Comments